Primary Weather Charts:
- Radar Chart shows precipitation & intensity
- Satellite Chart shows clouds
Surface Analysis Charts shows front (air mass) and area of high and low pressure
4 Types of fronts:
- Warm front
- Cold front
- Stationary front
- Occluded front
H (air circulate right) represent High pressure area and generally is good flying condition
L (air circulate left) represent Low pressure area and associated with bad weather
Light grey lines are isobars and connect point of equal barometric pressure – when they’re close together a steep pressure exist (strong winds)
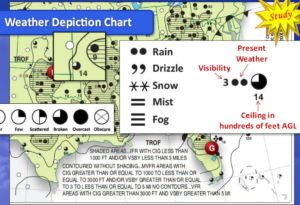
Weather Depiction Chart
Circle represents weather stations and cloud cover
IFR: Instrument Flight Rules
MVFR: Marginal VFR
VFR: Visual Flight Rules
CIG: Ceiling (lowest bkn or ovc)
Legend:
Bottom: No Contours.. VFR areas with CIG greater than 3000ft and vsby greater than 5mi.
(the ceiling lowest layer of broken or overcast clouds is a least 3000ft above the surface and the visibility is greater than 5sm)
Middle: Countered without shading…MVFR areas with CIG greater than or equal to 1000 to less than or equal to 3000ft and/or vsby greater than or equal to 3 to less than or equal to 5mi
(the ceiling between 1000ft and 3000ft AGL and/or the visibility is greater than 3mi but equal to or less than 5mi)
Top: Shaded areas…IFR with CIG less than 1000ft and/or vsby less than 3mi
(fly by instrument the ceiling is less than 1000ft AGL and/or the visibility is less than 3mi)
Four-Panel Prognostic Chart:
(allow the pilot to avoid ceilings, turbulence, freezing levels)
The top 2 panel forecast surface to 24,000ft AGL
The bottom 2 panel forecast surface conditions (show fronts, pressure center & weather symbols)
The left 2 panel forecast conditions for 12 hours
The right 2 panels forecast conditions for 24 hours
Airmets & Sigmets:
Concise descriptions of weather phenomena that exist or are forecast and may affect aircraft safety.
Airmet: report less severe weather than sigmet important for light aircraft. They report moderate turbulence and icing, sustained surface winds of 30 knots or more, or widespread restricted visibility.
Sigmet: applies to all aircrafts they report weather conditions that are more severe than those reported in airmets.
Convective Sigmet: report the most severe weather phenomena including tornadoes, lines of thunderstorms, embedded thunderstorms, large areas of thunderstorms of intensity level 4, and or hail greater than or equal to 3/4 inch in diameter.

